Trends and forecast
The demand sagged by 30% over Q3 2024 versus the second quarter (by the number of shared-equity agreements)
The share of mortgage-backed transactions contracted by 17 p.p. over the quarter to the level of 64%.
The weighted average price of supply rose by 4% over the quarter
As of the end of Q3 2024, the weighted average price per square metre in the St. Petersburg off-plan housing market across comfort, business and premium-class segments amounted to RUB 286,000 per sq m.
The volumes of residential housing construction contracted by 15% year-on-year
In the short-term outlook the given parameter will disable any significant reduction of the average price in St. Petersburg off-plan housing supply, whereas in the mid-term outlook it will whip up growth.
The key driver of sales is the Family Mortgage program
The low level of bank limits under the government program and, accordingly, the preservation of tightened claims on borrowers negatively affects the demand dynamics.
Long-term installment plans
Rapidly developing are long-term installment plans, with the extention of payments to the period after commissioning.
Elizaveta Conway, director Residential Real Estate and Land Development Department at Nikoliers: "In Q3 2024 the market was being stabilized after termination of the preferential state-backed mortgage program at the interest rate of 8%, as well as a change in the terms of the family mortgage program and exclusion of Saint Petersburg from the IT mortgage plan. Amid a certain cooldown of demand, we see an increase in the number of covert discounts in the form of special prices for a specific pool of lots and interest-free installment plans on offer."
Main indicators
Key market indicators following Q3 2024*

Dynamics of key market indicators

*Hereinafter registered shared-equity agreements of individuals to residential premises (residential units and apartments) are taken into account with the exception of wholesale transactions and elite-class housing. The asked prices do not cover possible discounts.
Source: Nikoliers
New projects
A high level of the key interest rate, cooldown of demand and growing construction costs slow down the rollout of new projects to the market.
In the third quarter of 2024, in keeping with project declarations, 367,000 sq m of residential real estate were rolled out to the market, which is 7% more than in the previous quarter. Neverteless, the total living space commissioned for January - September 2024 is 20% less than for the comparable period of 2023, when developers were seeking the maximum expansion of exposure to satisfy the demand whipped up by then effective preferential mortgage programs. The growth of the key interest rate as well as considerable tightening of the regulator’s forecast regarding this indicator’s range for the next two years also affects the pace of new project commissioning.
Dynamics of new supply by project declarations, thou sq m

Source: Nikoliers
In July-September 2024, buildings in 19 projects, of which seven with a total of 3,500 lots were to be launched as announced, were added to the market. It is noteworthy that the number of business class lots rolled out doubled over the quarter - the segment is less dependent on state housing mortgage programs, while the projects usually have more unique characteristics as regards the location and product concept.
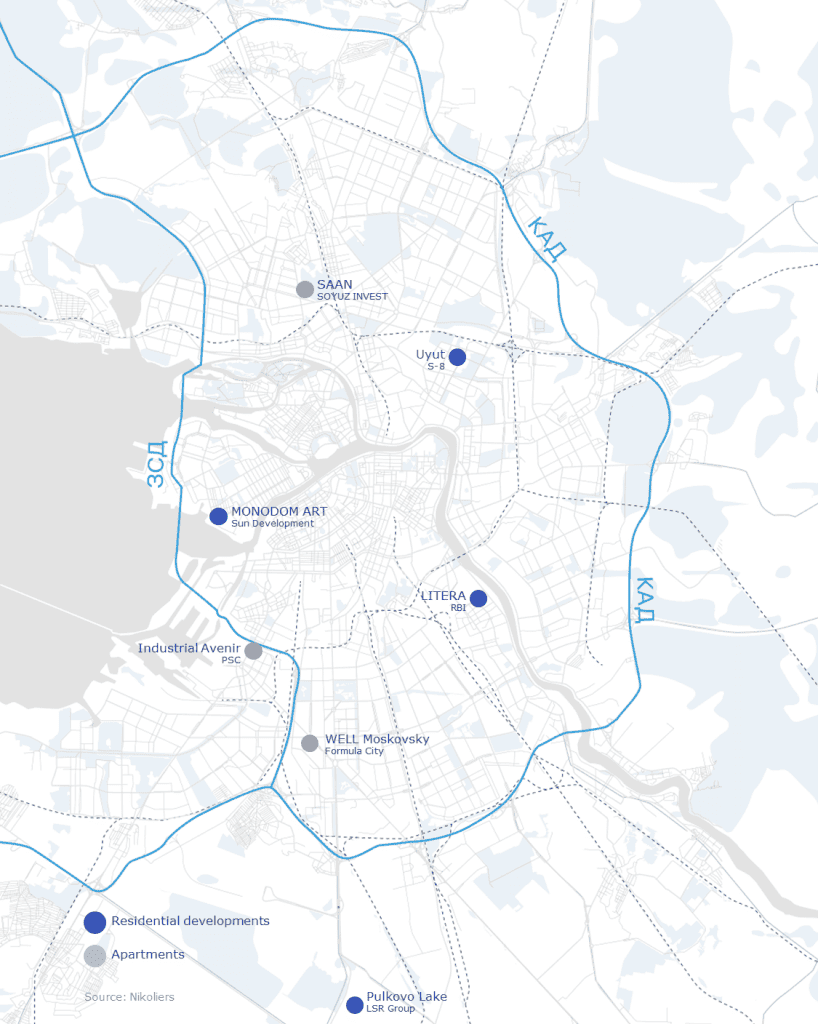
During the quarter, the following new projects with residential units and apartments entered the St. Petersburg market:
Comfort class: Industrial Avenir (PSK), Pulkovo Lake (LSR Group), Uyut (S-8)
Business class: LITERA (RBI), MONODOM ART (Sun Development), SAAN (SOYUZ INVEST), WELL Moskovsky (Formula City)
Nevsky (20%), Vasileostrovsky and Moskovsky districts (18% each) were leaders by the volume of new supply rolled out.
New projects launched
Supply

Breakdown of housing in exposure by classes and types of floor plans

Based on the results for Q3 2024, St. Petersburg’s exposure in comfort, business and premium-class segments amounted to 36,000 lots or 1.7 million sq m (-4% over the quarter). The supply has sunk by 13% over the year because demand exceeded the new supply rolled out to the market.
Comfort-class housing traditionally prevails in the supply accounting for 70% of total lots; yet over the quarter this indicator went down by 6 p.p. while the share of business segment, on the contrary, has grown from 19% to 27%.
Apartments account for a significant share of supply (15%), but in case of legislative regulation of this segment in Saint Petersburg, similarly to what was done in Moscow, their gradual removal from exposure is quite possible.
The average area of a lot on sale, as of the end of Q3 2024, amounted to 47 sq m: 49 sq m for residential units and 36 sq m for the apartment segment.
Pushkin (13%), Primorsky (12%) and Moskovsky (10%) districts are leaders in terms of supply.
Breakdown of housing in exposure by classes and districts

Source: Nikoliers
Prices
|
+4% |
Growth of the weighted average asked price over the quarter |
The weighted average price per sq m in the Saint Petersburg off-plan residential housing market across comfort, business and premium-class segments came to 286,000 RUB/sq m at the end of the third quarter, 2024. This indicator grew by 9% over 12 months and by 7% since the beginning of 2024, the highest dynamics being shown in the third quarter. The maximum increase both in quarterly and annual terms has been recorded in the premium-class segment due to the start of sales in the new projects of Petrograd and Central districts.
Breakdown of the weighted average price per sq m by districts; dynamics versus Q2 2024
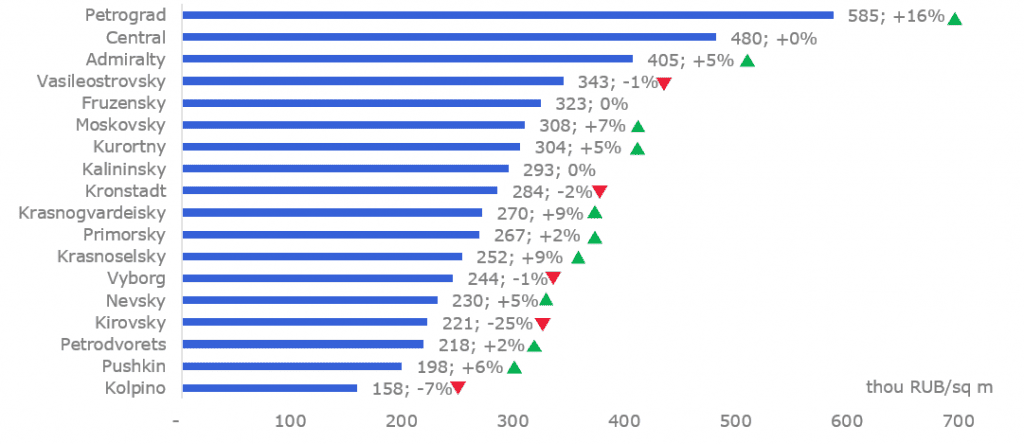
The most significant reduction of average asked prices was demonstrated by Kirovsky district on account of the new apartment project Industrial Avenir (PSK) with the lowest cost of lots for the serviced format being rolled out to the market. For a number of comfort-class residential developments, we saw a decrease in weighted average prices, but for the majority of mass-market projects, developers prefer to use hidden discounts, promoting a certain pool of lots or offering long-term installment plans.
As of the end of the third quarter, the residential housing construction volumes in Saint Petersburg sharnk by 15% YoY.
Dynamics of the weighted average price per sq m and construction volumes

Source: Nikoliers
Demand

Breakdown of registered shared equity agreements by classes and types of floor plans for Q3 2024

The number of registered shared-equity agreements in St. Petersburg’s comfort, business and premium-class housing segments in the third quarter of 2024 stood at 9,650 (385,000 sq m), which is 30% lower than the results for the second quarter and 28% lower in terms of sold square meters. The share of apartments in the structure of transactions is low at 5% versus 15% in the total supply of lots.
The total volume of transactions for the first nine months of this year is comparable to the same indicator for January - September 2023 by the number of transactions (+1%), but it’s 5% less in terms of total square meters sold. Buyers chose smallr-sized lots - 39.3 sq m (-2 sq m year-on-year) on average.
In January - September 2024, the share of mortgage loans stood at 74% (-11 p. p. year-on-year), while in the third quarter a significant decline to 64% was recorded (-17 p. p. versus Q2). The low level of bank limits under the “Family Mortgage” program and, accordingly, the preservation of tightened claims on borrowers negatively impacted the demand dynamics.
Dynamics of demand for apartments (number of shared equity agreements) and the weighted average rate on issued housing mortgage loans
 and the weighted average rate on issued housing mortgage loans (1).png")
Sources: Nikoliers, Unified Residential Housing Construction Information System